
Fewer Closings, Bigger Checks: Cape San Blas Leads With a $3.9 Million Sale
Saturday marked eight years since Hurricane Michael came ashore at Mexico Beach. Anybody who was here on October 10, 2018 remembers exactly where they rode it out, and anybody who drives 98 through town today can see what this community rebuilt with its own two hands. Streets that were nothing but slabs and sand after the storm have families on the porch again. That kind of comeback doesn't show up in a spreadsheet, but it's the reason there's a market here to write about at all.
The market itself took a breath this week. 10 homes closed between October 5 and 11, half of last week's 20, but the checks got a lot bigger. The average sale jumped to $1,211,499 on $12.11 million of volume. Out on Cape San Blas, one buyer closed on a $3,900,000 home, the largest residential sale in the six weeks behind this report.
What is the Forgotten Coast real estate market doing this week?
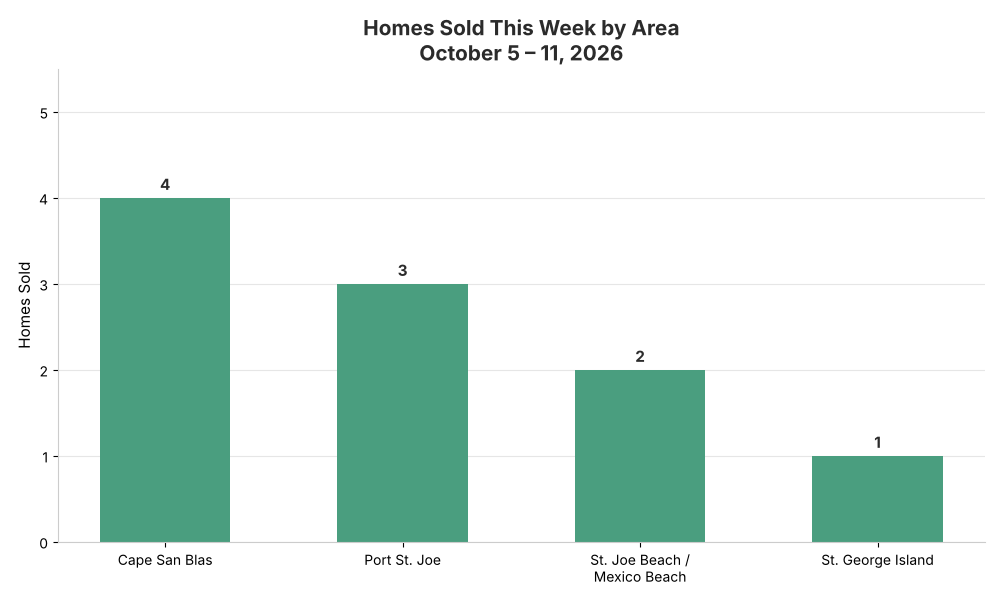
For the week of October 5–11, 2026, the Forgotten Coast recorded 10 residential closings and 3 vacant land sales across Port St. Joe, Cape San Blas, St. Joe Beach, Mexico Beach, and St. George Island. Active inventory slipped to 523 residential listings, which reads 8.4 months of supply on the three-week average, up from 7.8 months last week. Fewer homes sold, but 6 of the 10 closed at $930,000 or more.
Sales ran from $80,000 to $3,900,000. Every area closed at least one home for the fourth week in a row, so the slowdown was spread around rather than parked in one spot. The number I'm watching is the pipeline. Only 9 homes went under contract, down from 14, which ties the lowest pending count of the last six weeks. That's the number that tells you what the next couple of weeks will look like.
Cape San Blas and the South Gulf
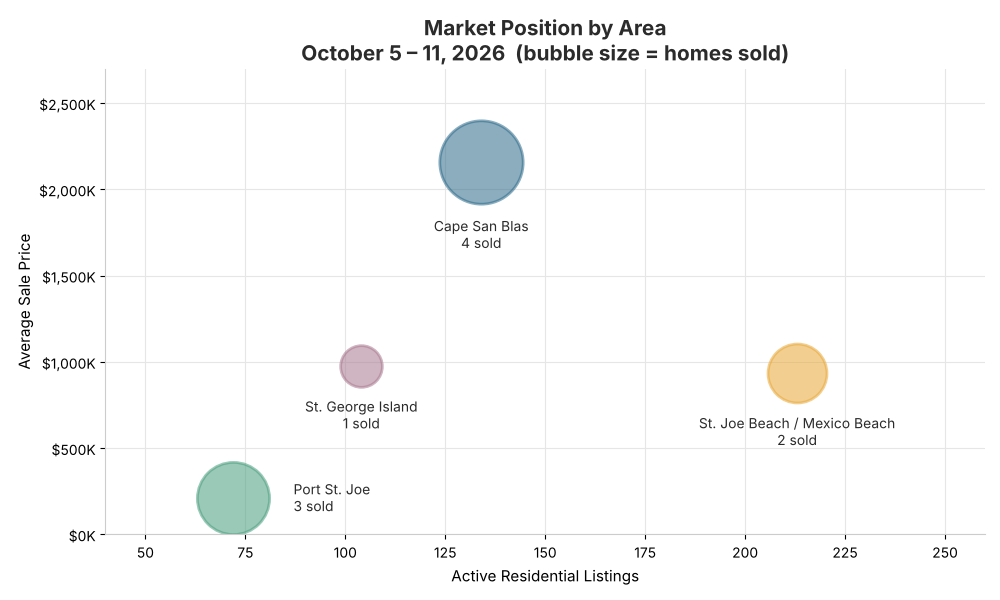
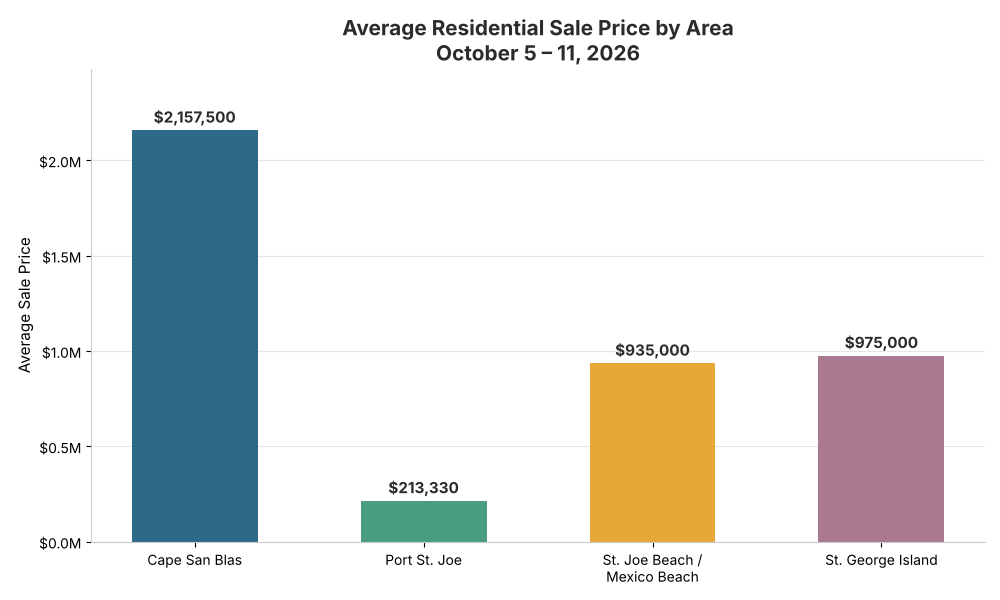
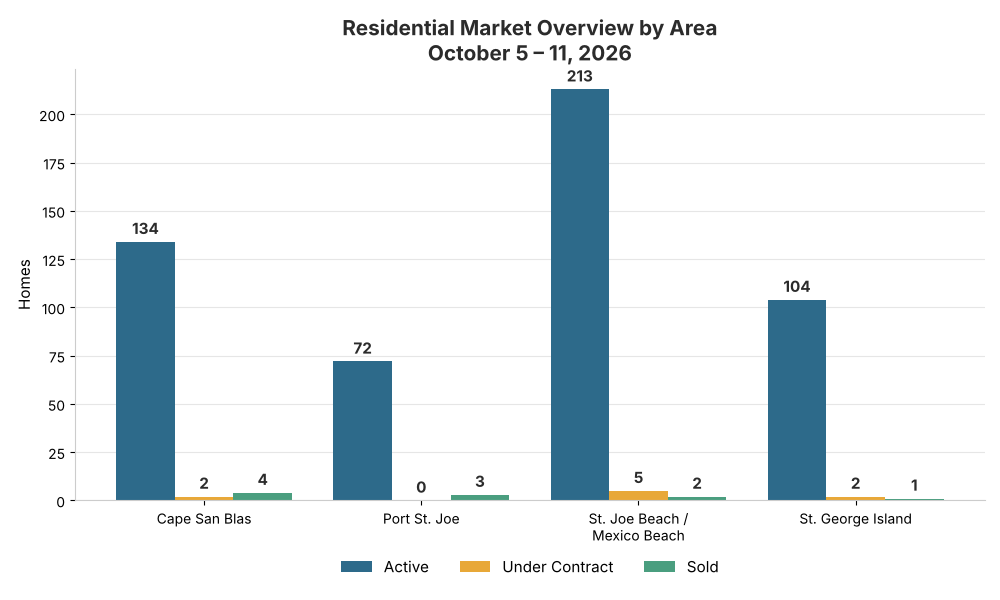
Last week I called the Cape the soft spot on this coast. It answered with 4 closings between $930,000 and $3,900,000, averaging $2,157,500. Four sales ties the Cape's best week in the stretch I'm tracking, and that average is the highest it has posted in any of those six weeks.
The supply picture changed fast. On the three-week pace, the Cape now reads 13.3 months of supply, down from 23.9 last week. Active listings dropped to 134, the fewest the Cape has carried in six weeks, and 2 homes are under contract, same as last week. It's still the loosest market of the four, and buyers still have room to negotiate out here. What this week proved is that the buyer for a big house on the peninsula is real, and when the right one shows up, they close.
St. Joe Beach and Mexico Beach
After a 10-home week, the corridor came back to earth with 2 closings, at $460,000 and $1,410,000. With only two sales the $935,000 average says more about that one big closing than about the whole beach, so I wouldn't read a price trend into it.
The three-week supply reading rose to 7.8 months from 7.1. Active inventory dipped to 213, the lowest count the corridor has shown in six weeks but still the deepest shelf on the coast. Pending contracts held at 5. That's the healthiest pipeline of the four areas right now, which makes me think this quiet week is a pause and not a turn.
Port St. Joe
Town closed 3 homes from $80,000 to $319,990, averaging $213,330. That's the lowest Port St. Joe average in the six weeks I'm tracking, pulled down by the sale at the bottom of the range. Active listings held at 72, flat with last week, after four straight weekly declines.
On the three-week pace, Port St. Joe reads 5.5 months of supply, up a touch from 5.0 and still the tightest market on the Forgotten Coast. Here's the wrinkle. Pending contracts went from 5 to 0, the first week without a single home under contract in town in the six weeks behind this report. One week doesn't make a trend, and a thin shelf can produce a thin pending count. If that number stays at zero next week, though, I'll be watching it closely.
St. George Island
The island closed 1 home, at $975,000. After 4 closings last week and a $3 million sale at the top, a single sale under a million reads like a quiet week more than a cooling one.
Still, the numbers moved. The three-week supply figure climbed to 9.0 months from 5.9, and active listings ticked up to 104 from 103, the first increase in three weeks. 2 homes are under contract for the third straight week. The island gave back a little of the seller's edge it had last week. A buyer who has been circling St. George has a bit more room this week than last.
The Land Market
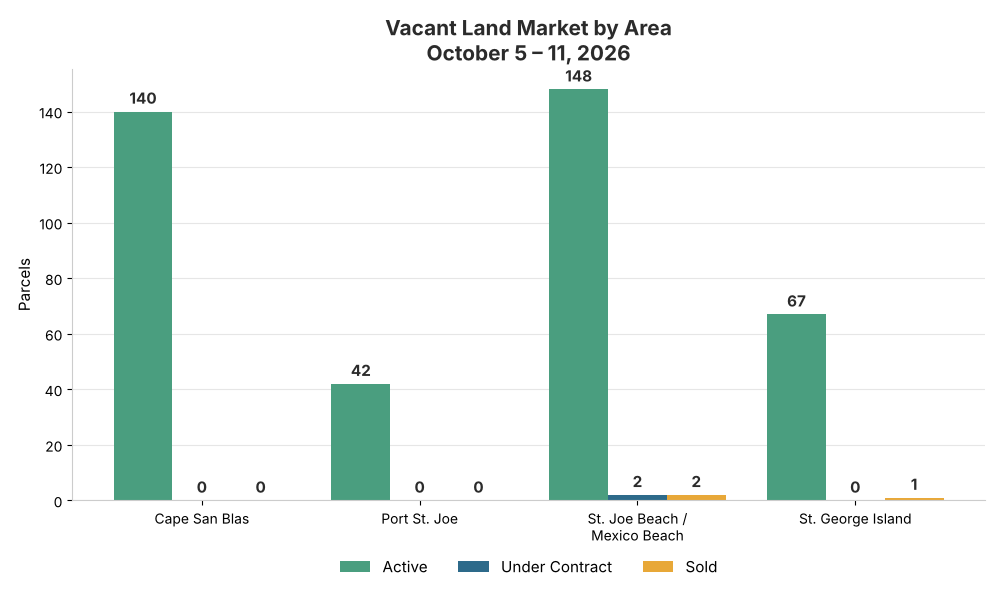
Last week I said the thin land pipeline could mean quiet numbers ahead, and that's what showed up. 3 lots sold, down from 5, on $369,800 of volume, the smallest land total in six weeks. The average fell to $123,267, also the lowest weekly land average in that stretch.
The beach corridor sold 2 lots, at $129,900 and $139,900. St. George Island added 1 lot at $100,000. Cape San Blas and Port St. Joe went without a land sale for the second straight week.
Land inventory rose to 397 active parcels from 394, and just 2 lots are under contract, matching last week for the fewest in six weeks. At this week's pace the land market carries 30.6 months of supply, up from 18.2 last week. Smoothed over three weeks it's closer to 22.9 months. Either way, anyone shopping for a lot to build on has the upper hand and plenty of time to pick.
What the Pace Actually Means
Ten sales a week projects to about 43 homes a month, which against 523 active listings reads 12.1 months of supply. That's a buyer's number, but it's one week, and I wouldn't lean on it any harder than I leaned on last week's 6.1.
The three-week figure is the one I trust, and it moved the wrong direction this week. The coast has averaged about 14.3 closings a week over the last three weeks, which puts supply at 8.4 months, up from the 7.8 months I published last week. The reason is simple. The 14-closing week of September 14–20 rolled out of the window and this 10-closing week rolled in. The good news is on the other side of the ledger. Active inventory fell for the fifth straight week to 523, the lowest count in the six weeks behind this report.
Here's where the negotiating power sits. Port St. Joe is the only area under 6 months of supply, so sellers in town still hold the stronger hand. The beach corridor sits near the middle at 7.8 months. St. George Island drifted toward buyers at 9.0, and Cape San Blas, even after its best week of the fall, is still a buyer's market at 13.3.
A Note on What This Report Covers
This weekly report tracks residential and vacant land activity across Florida's Forgotten Coast, covering the Port St. Joe real estate market, Cape San Blas and the South Gulf, the St. Joe Beach and Mexico Beach corridor, and the St. George Island market. Each week it pulls active listings, pending contracts, closed sales, price ranges, and months of inventory from the MLS and runs them the same way, so the week-to-week comparisons actually mean something.
What Mid-October Looks Like From Here
The mornings have finally turned. You can sit on the porch with a cup of coffee and not break a sweat, and the redfish are working the grass flats on St. Joseph Bay like they know the water's cooling off. The summer crowd is long gone, and the folks still walking the beach at sunset are mostly the ones who live here or wish they did.
Weeks like this one remind me that this market doesn't move in a straight line. Half as many closings came with a much bigger top end, and the pipeline needs to fill back up before the holidays. Sellers who are priced right are still getting to the closing table. Buyers who have been waiting on the Cape or the island have a stronger hand than they had a week ago, and in October on the Forgotten Coast, that's a good place to be standing.
If you're thinking about buying or selling this fall and want a straight read on what the data means for your situation, reach out. No pressure, just a real conversation about the market from someone who lives and works here.
Key Metrics Summary
|
|
Area Detail
| Area | Active | Under Contract | Sold | Sold Price Range | Avg Sold Price | Months Supply (3-Wk) |
| Cape San Blas / South Gulf | 134 | 2 | 4 | $930,000 – $3,900,000 | $2,157,500 | 13.3 |
| Port St. Joe | 72 | 0 | 3 | $80,000 – $319,990 | $213,330 | 5.5 |
| St. Joe Beach / Mexico Beach | 213 | 5 | 2 | $460,000 – $1,410,000 | $935,000 | 7.8 |
| St. George Island | 104 | 2 | 1 | $975,000 | $975,000 | 9.0 |
Vacant Land Detail
| Area | Active | Under Contract | Sold | Sold Price Range |
| Cape San Blas / South Gulf | 140 | 0 | 0 | None |
| Port St. Joe | 42 | 0 | 0 | None |
| St. Joe Beach / Mexico Beach | 148 | 2 | 2 | $129,900 – $139,900 |
| St. George Island | 67 | 0 | 1 | $100,000 |
Enjoy this blog post? Click here to subscribe for updates
Leave A Comment