
The Beach Corridor Carries the Week While the Pipeline Takes a Breath
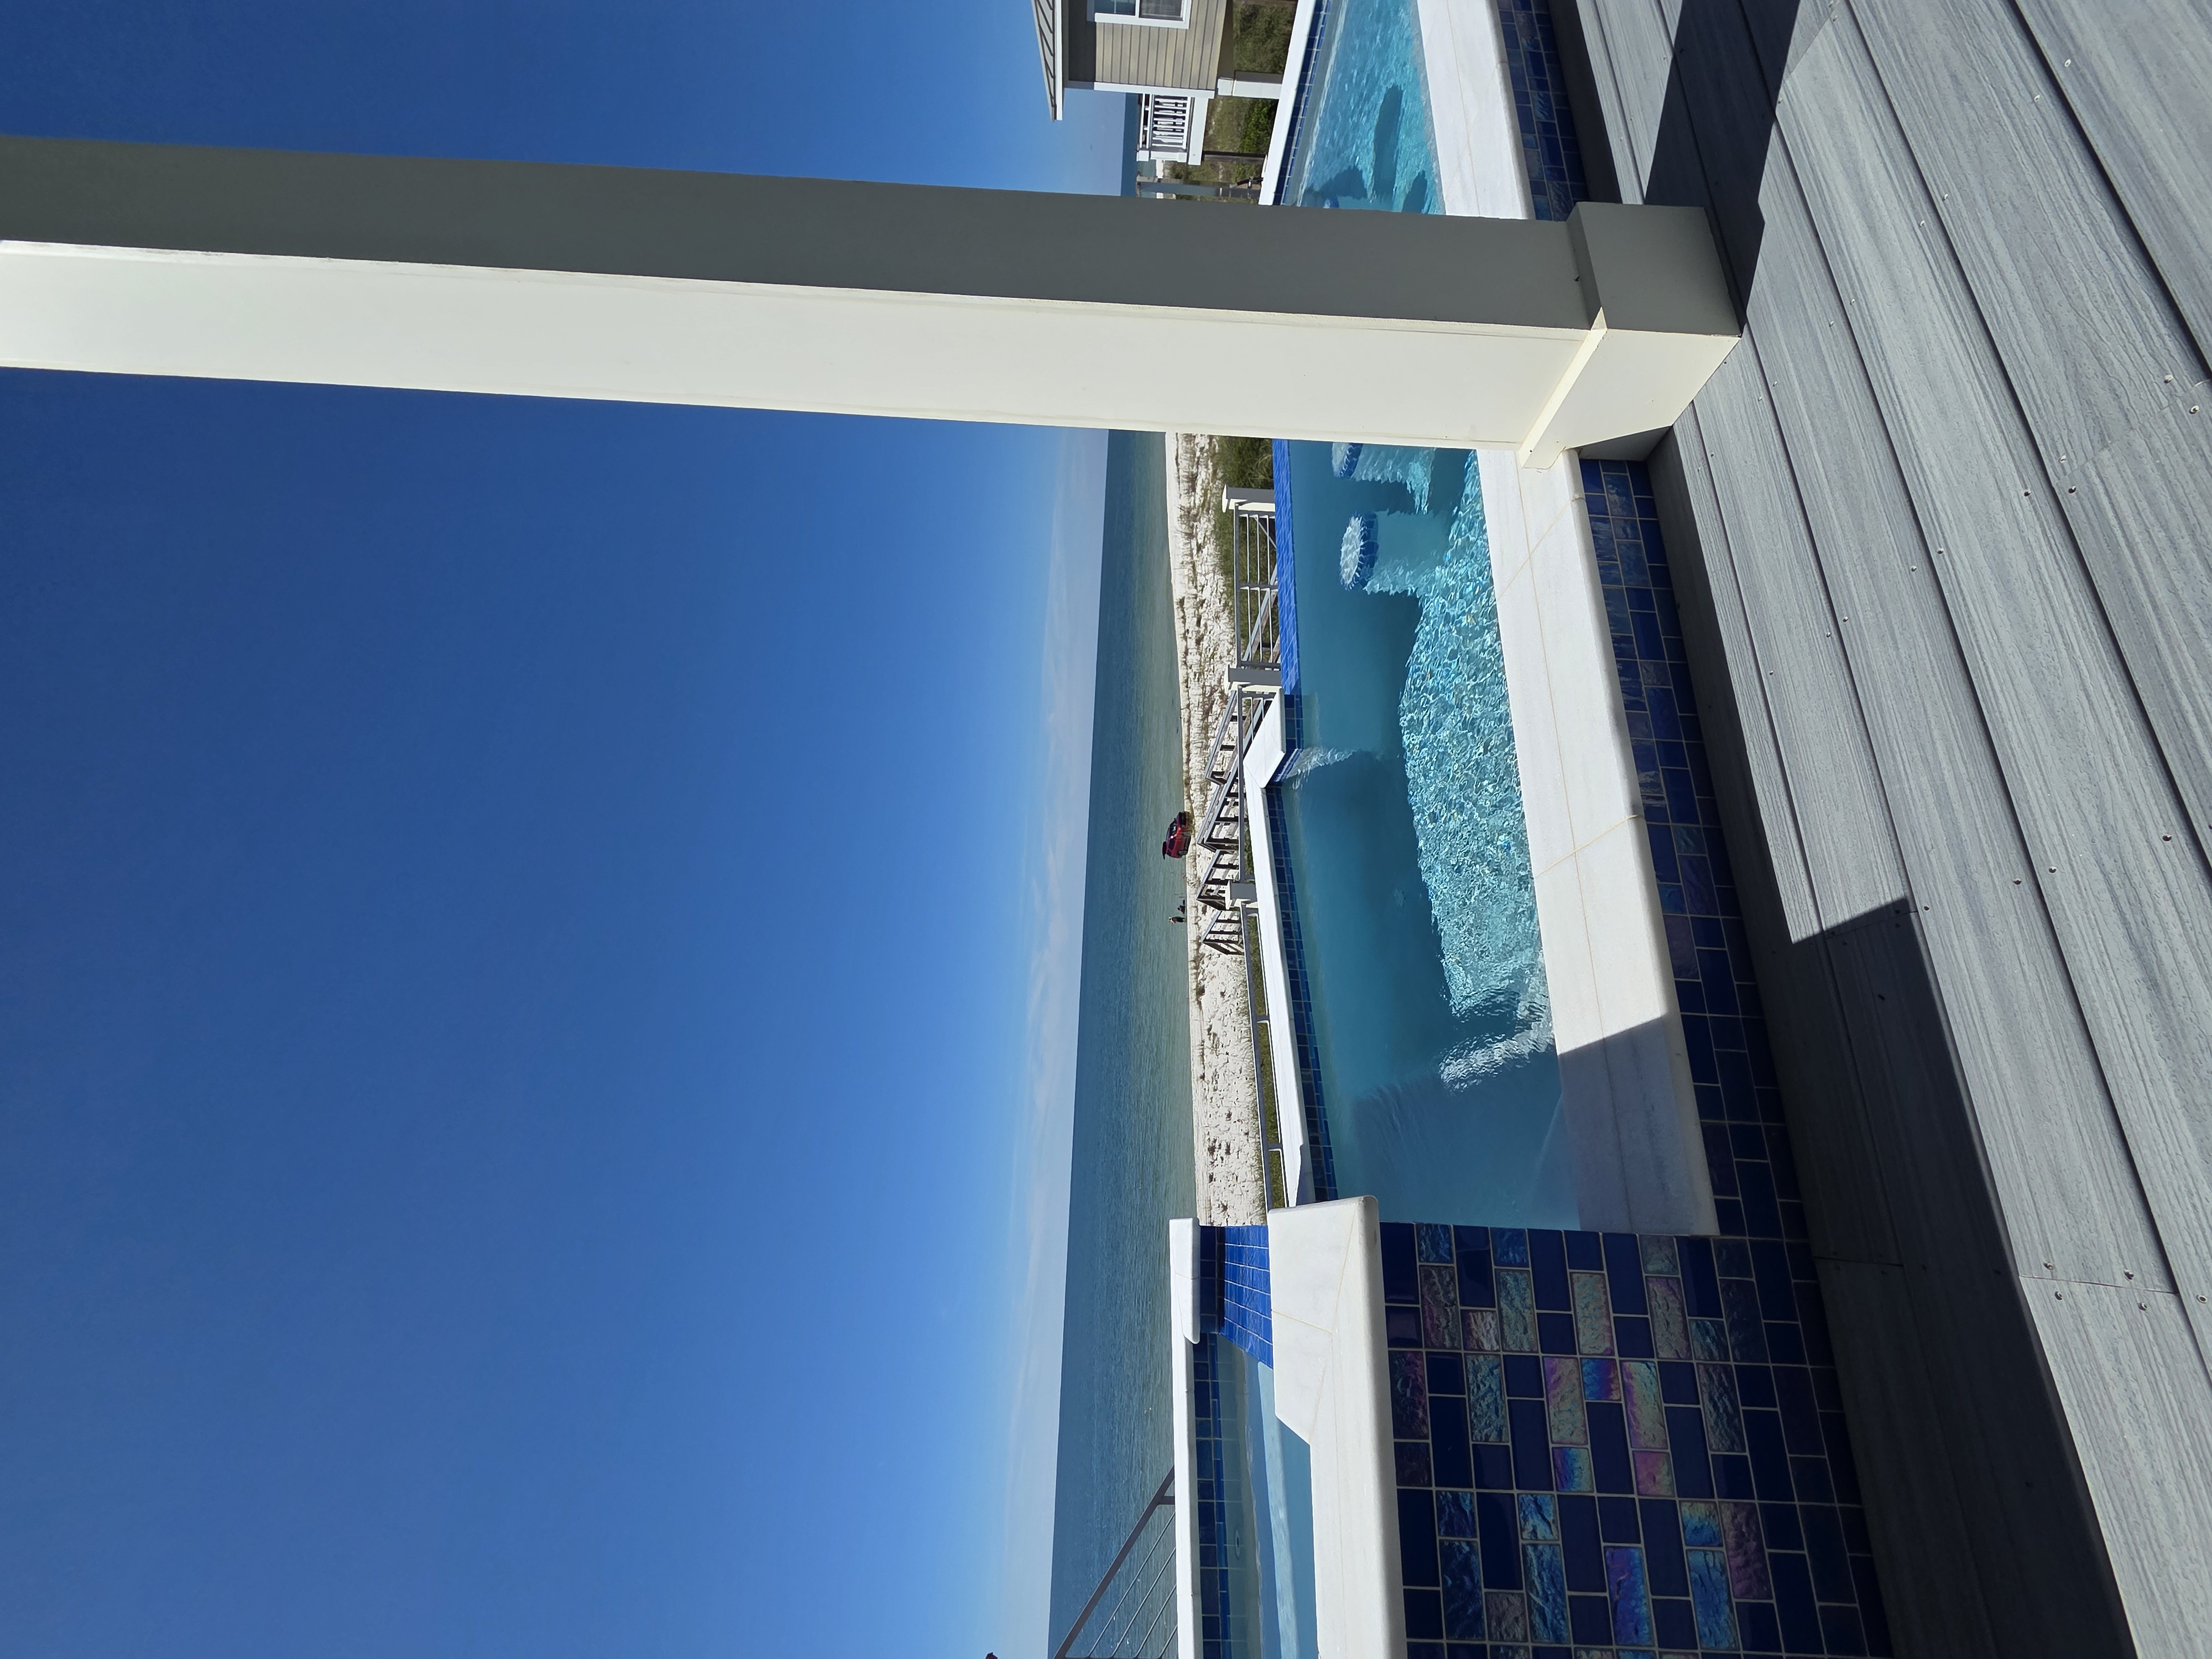
Fall showed up on the calendar this week, and out here you could tell without looking. Mornings on Reid Avenue came in a few degrees cooler, the bay went still enough to see the redfish pushing bait along the grass flats, and the traffic heading to the Cape on a Saturday was mostly trucks with fishing rods sticking out the back.
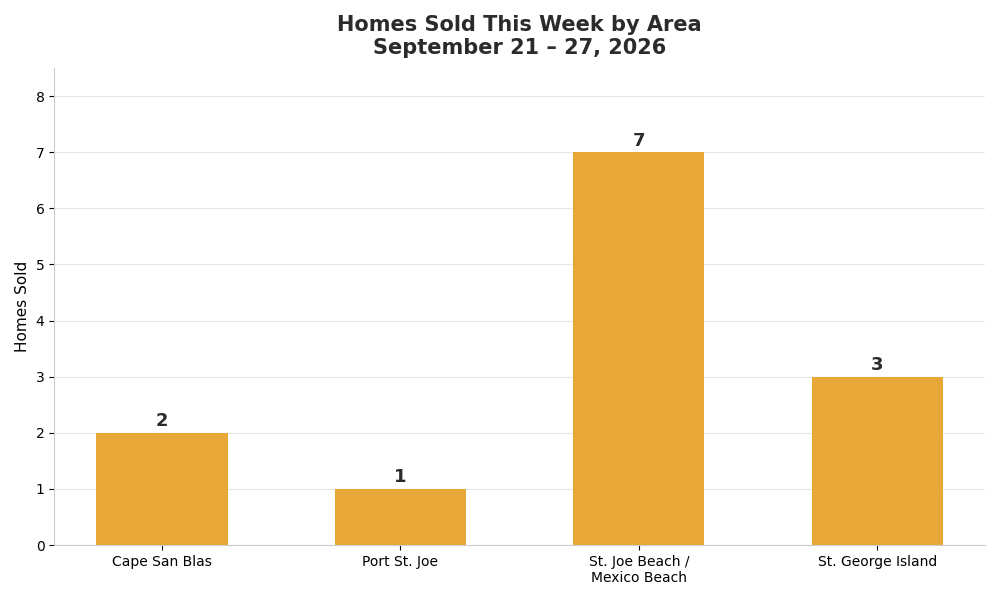
The market kept its footing through the change of seasons. Thirteen homes closed on the Forgotten Coast between September 21 and 27, one fewer than last week, on $9.02 million of volume. The stretch between St. Joe Beach and Mexico Beach did the heavy lifting with 7 of the 13 closings, including a $2,425,000 sale that was the biggest of the week anywhere on the coast. The number I'm watching hardest, though, is the one that tells us about October.
What is the Forgotten Coast real estate market doing this week?
For the week of September 21–27, 2026, the Forgotten Coast recorded 13 residential closings and 4 vacant land sales across Port St. Joe, Cape San Blas, St. Joe Beach, Mexico Beach, and St. George Island. Active inventory sits at 539 residential listings, or 9.6 months of supply at this week's pace and 12.0 months on the steadier three-week average. Homes under contract fell to 9 coast-wide from 20, the thinnest pipeline in the four weeks behind this report.
Sales ran from $259,900 to $2,425,000 and averaged $693,477. Every one of the four areas closed at least one home for the second week in a row, which is a quiet sign of health. Buyers aren't crowding into one corner of the coast. They're spread out, buying where the house and the price line up.
St. Joe Beach and Mexico Beach
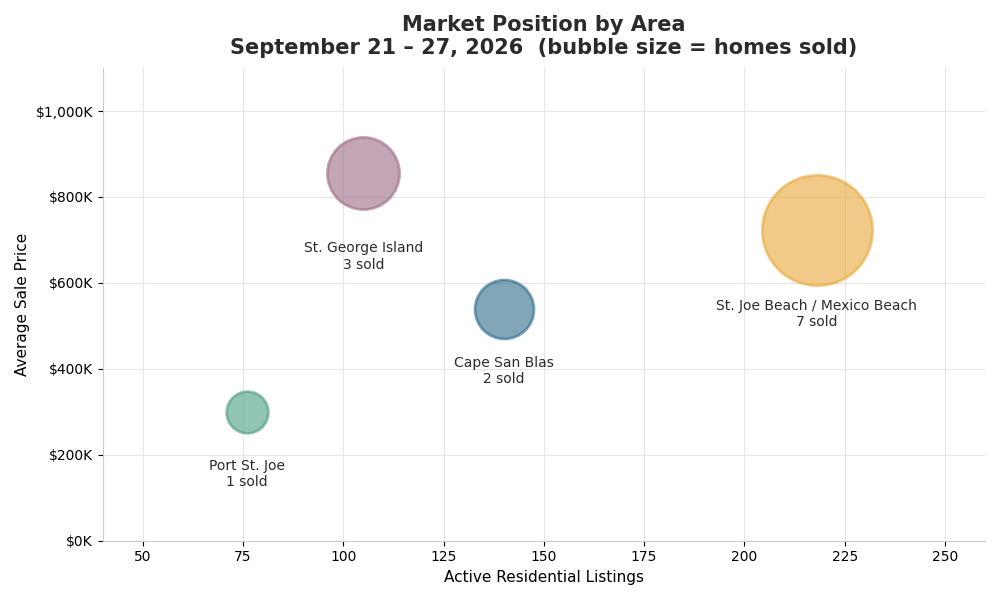
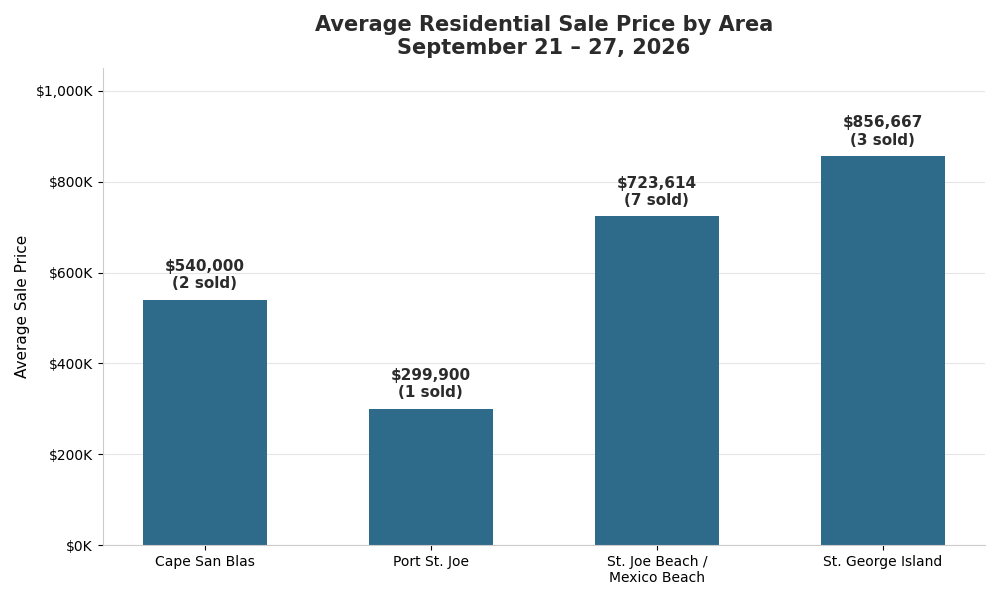
The corridor closed 7 homes between $259,900 and $2,425,000, averaging $723,614. That ties its best week in the four covered here and posts its highest weekly average of the stretch by a long way. Before anybody gets excited about that average, take the top sale out and the other six came in around $440,000, right where this stretch of beach has been living. The $2.4 million sale is real, and it says there's a buyer for the top of this market. The rest of the week says the corridor is still what it has always been: the most attainable way to own a piece of the Gulf on this coast.
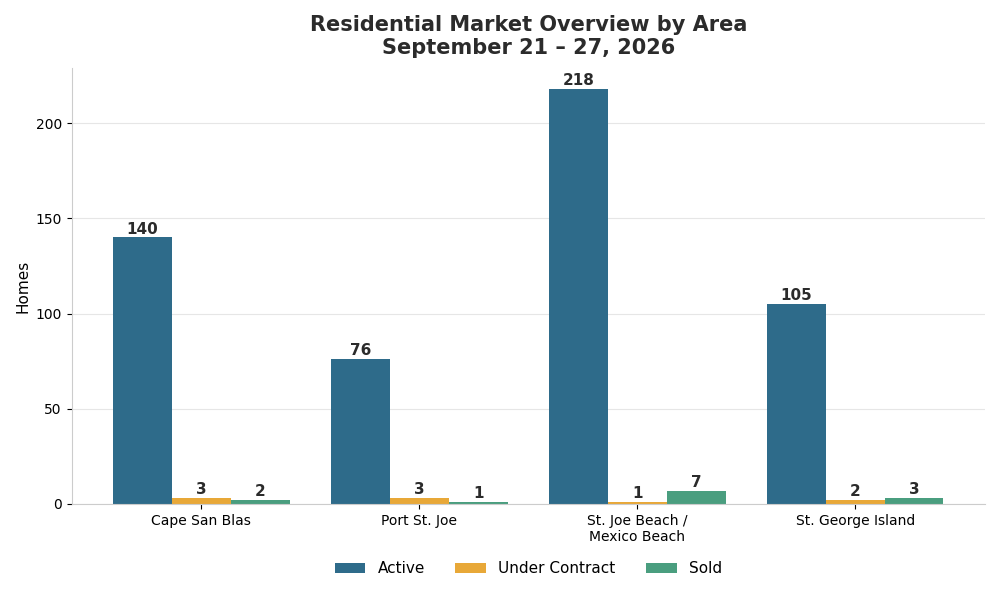
The pending column is the caution flag. Just 1 home under contract, down from 8 last week and the lowest count the corridor has carried in the month behind this report. Active inventory also rose to 218 from 214, still the deepest on the coast by a wide margin. The three-week supply reading barely moved, 11.6 months against 11.4 last week. Sellers here are selling. They just need to watch whether the next round of buyers shows up in the next couple of weeks.
St. George Island
After last week's five-sale run, the island closed 3 homes from $335,000 to $1,250,000, averaging $856,667. A normal week for St. George, and a healthy one. It remains the tightest of the four areas on the three-week pace at 9.1 months of supply, up a little from 8.2 as its four sales from the week of August 31 rolled out of the window.
Inventory slipped to 105 active listings from 107, and 2 homes are under contract, down from 4. Nothing about the island's numbers suggests the buyers have gone anywhere. They're just pickier than they are in April, and they can afford to be.
Port St. Joe
Town closed 1 home, at $299,900. One sale after four is a slow week, not a turn, and a closing right under $300,000 is exactly the kind of house this town needs more of.
The bigger story in Port St. Joe is inventory. Active listings dropped to 76 from 83, the largest weekly decline of any area and the fewest active homes in town across the four weeks behind this report. It's also the smallest inventory on the coast. Pending contracts eased to 3 from 8, and with last week's four closings now averaged against this week's one, the three-week supply figure rose to 10.5 months from 9.6. If you've got a well-kept house in town under $400,000, you're competing against fewer listings than you were a month ago.
Cape San Blas and the South Gulf
The Cape closed 2 homes, at $420,000 and $660,000, for an average of $540,000. That's the lowest weekly average the Cape has posted in the four weeks behind this report, and it tells you where the buyers were this week. The entry end of the peninsula moved. The million-dollar Gulf-front end did not.
There's good news in the pipeline. 3 homes went under contract after two straight weeks with none, which takes some of the edge off the thin-October worry I raised last week. The harder number is supply. Active inventory rose to 140 from 137, its second weekly increase in a row, and with the 4-sale week of August 31 now out of the three-week window, the Cape reads 19.4 months of supply, up from 13.6. That's the loosest of the four areas by a wide gap. Buyers shopping the Cape, especially above $900,000, have more negotiating room right now than anywhere else on this coast.
The Land Market
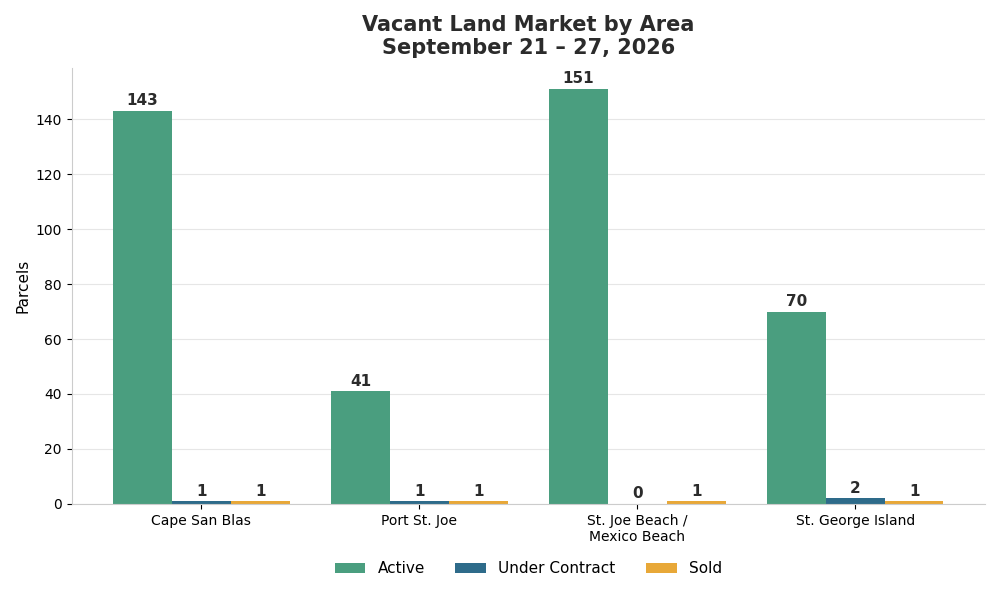
Four lots traded for the second straight week, one in every area, on $1.02 million of volume. The average came in at $255,750, down from last week's $340,000 but still the second-highest weekly land average of the month.
St. George Island led on price with 1 sale at $450,000, its first lot sale since the 2 it closed the week of September 7–13. Cape San Blas added 1 at $278,000, the beach corridor 1 at $165,000, and Port St. Joe 1 at $130,000, the low end of the week.
Land inventory climbed again to 405 active parcels from 400, the second straight increase and the highest count of the four weeks. Pending lots held at 4, tied for the lowest of the stretch. At this week's pace that's 23.4 months of supply. If you're a builder or someone who's been waiting to buy a lot and build later, this is a patient market with plenty to choose from, and sellers are starting to feel it.
What the Pace Actually Means
Thirteen sales a week projects to about 56 homes a month, which against 539 active listings reads 9.6 months of supply. That's a respectable weekly number.
The three-week average is less flattering, and I'll give it to you straight. The coast has averaged about 10.3 closings a week over the last three weeks, putting the smoothed supply figure at 12.0 months, up from the 10.7 months I published last week. That happened because the strong 17-sale week of August 31 rolled out of the window while the 4-sale holiday week of September 7–13 stayed in. That holiday week drops out next Monday, so if closings hold anywhere near this pace, the smoothed number should come back down.
What I can't explain away is the pipeline. 9 homes under contract coast-wide, down from 20 last week and the lowest count of the four weeks behind this report. Closings lag contracts by a month or so, which means the first half of October could run lighter than September did. On the other side of the ledger, active inventory fell again to 539 from 541, the lowest count of the month. Inventory isn't piling up. New contracts just slowed down.
Where the negotiating power sits: buyers have the clearest advantage on Cape San Blas and at the high end anywhere on the coast. Sellers are in the best shape on St. George Island and in Port St. Joe, where inventory is the thinnest. The beach corridor sold the most homes this week but carries the most inventory, and it will need its pending count to recover before anyone calls it a seller's market.
A Note on What This Report Covers
This weekly report tracks residential and vacant land activity across Florida's Forgotten Coast: the Port St. Joe real estate market, Cape San Blas and the South Gulf, the St. Joe Beach and Mexico Beach corridor, and the St. George Island market. Every week it covers active listings, pending contracts, closed sales, price ranges, and months of inventory, pulled from the MLS and run the same way so the week-to-week comparisons actually mean something.
What the Fall Looks Like From Here
The next six weeks are my favorite time of year on this coast. The Gulf stays warm long after the summer crowd has gone home. The beaches from Indian Pass to the tip of the Cape get quiet enough that a morning walk feels private, and the bay fishing only gets better as the water cools. People who come down in October aren't here for a week of vacation. They're here to see what living here actually feels like.
That's the buyer who shows up this time of year, and it's the buyer this week's numbers are pointing to. Thirteen homes sold across every price band from under $300,000 to over $2.4 million. The houses that sold were priced for someone who has done the homework. With the pipeline down to 9, the sellers who win in October will be the ones who meet that buyer where the data says they are.
If you're thinking about buying or selling this fall and want a straight read on what the data means for your situation, reach out. No pressure, just a real conversation about the market from someone who lives and works here.
Key Metrics Summary
|
|
Area Detail
| Area | Active | Under Contract | Sold | Sold Price Range | Avg Sold Price | Months Supply (3-Wk) |
| Cape San Blas / South Gulf | 140 | 3 | 2 | $420,000 – $660,000 | $540,000 | 19.4 |
| Port St. Joe | 76 | 3 | 1 | $299,900 | $299,900 | 10.5 |
| St. Joe Beach / Mexico Beach | 218 | 1 | 7 | $259,900 – $2,425,000 | $723,614 | 11.6 |
| St. George Island | 105 | 2 | 3 | $335,000 – $1,250,000 | $856,667 | 9.1 |
Vacant Land Detail
| Area | Active | Under Contract | Sold | Sold Price Range |
| Cape San Blas / South Gulf | 143 | 1 | 1 | $278,000 |
| Port St. Joe | 41 | 1 | 1 | $130,000 |
| St. Joe Beach / Mexico Beach | 151 | 0 | 1 | $165,000 |
| St. George Island | 70 | 2 | 1 | $450,000 |
Enjoy this blog post? Click here to subscribe for updates
Leave A Comment