

A Frightfully Good Week on the Forgotten Coast: 20 Closings and a $3 Million Island Sale
October is the month for ghost stories, and this part of Florida comes by its share honestly. Port St. Joe grew up beside the bones of old St. Joseph, the boomtown that hosted Florida's constitutional convention in 1838 and then all but vanished within a few years, emptied out by yellow fever and finished off by a hurricane. Walk the bay shoreline at first light this time of year, when the fog sits low over the water and the marsh goes quiet, and you'll understand why folks around here still like a good haunted tale.
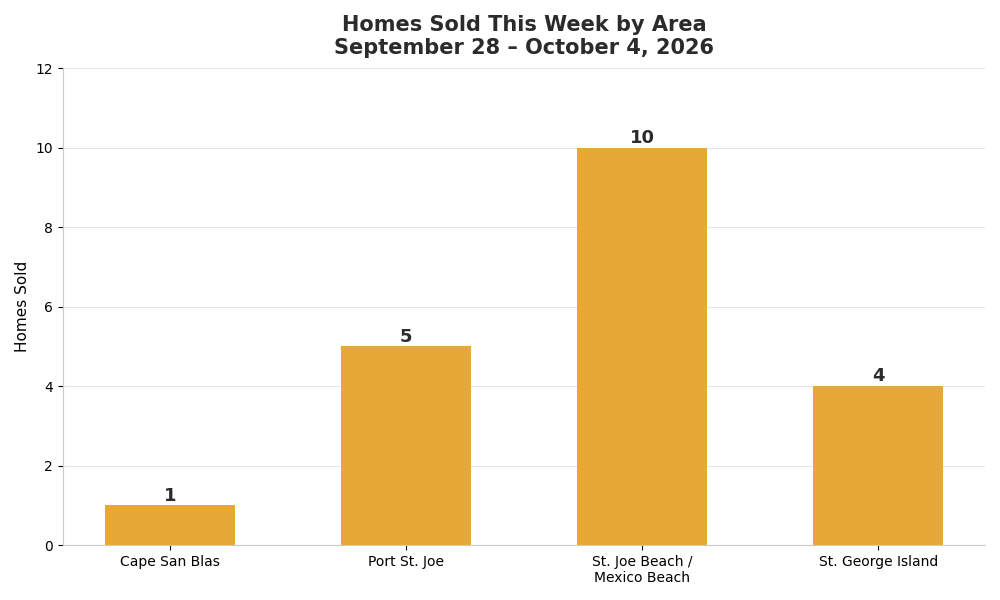
The market had nothing spooky about it this week. Twenty homes closed on the Forgotten Coast between September 28 and October 4, up from 13 the week before, on $15.22 million of volume. Both of those are the highest weekly figures since at least the end of August. St. George Island put a $3,000,000 sale on the board, and the beach corridor between St. Joe Beach and Mexico Beach closed 10 homes on its own.
What is the Forgotten Coast real estate market doing this week?
For the week of September 28–October 4, 2026, the Forgotten Coast recorded 20 residential closings and 5 vacant land sales across Port St. Joe, Cape San Blas, St. Joe Beach, Mexico Beach, and St. George Island. Active inventory fell to 529 residential listings, which reads 6.1 months of supply at this week's pace and 7.8 months on the three-week average, down from 12.0 months last week. Homes under contract rose to 14 from 9.
Sales ran from $269,900 to $3,000,000 and averaged $761,206. Every area closed at least one home for the third week in a row. Last week I worried out loud about a thin pipeline, and that worry hasn't come back to haunt anybody yet. 14 homes went under contract, up from 9, though still short of the 20 we saw two weeks ago.
St. George Island
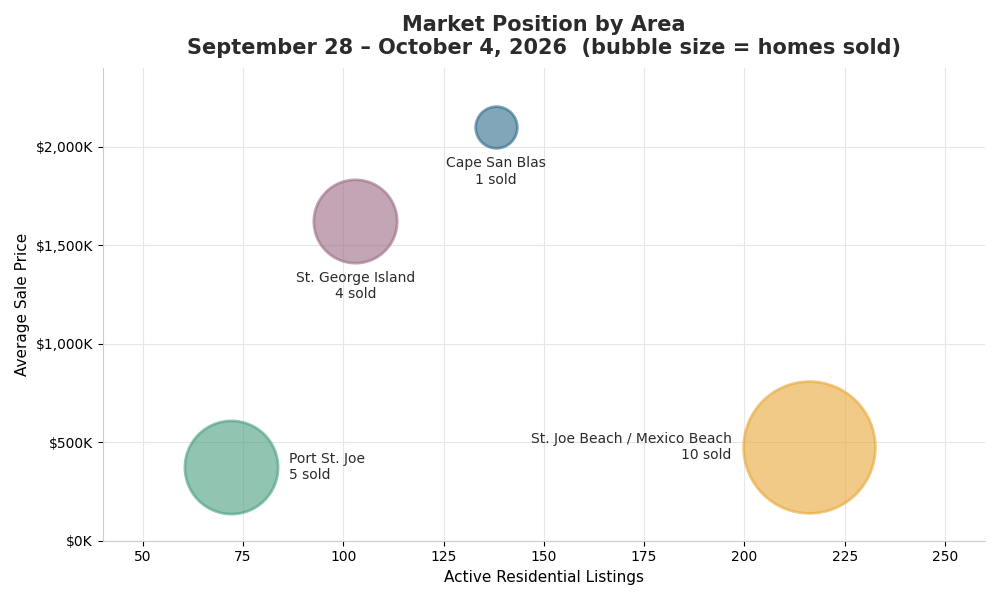
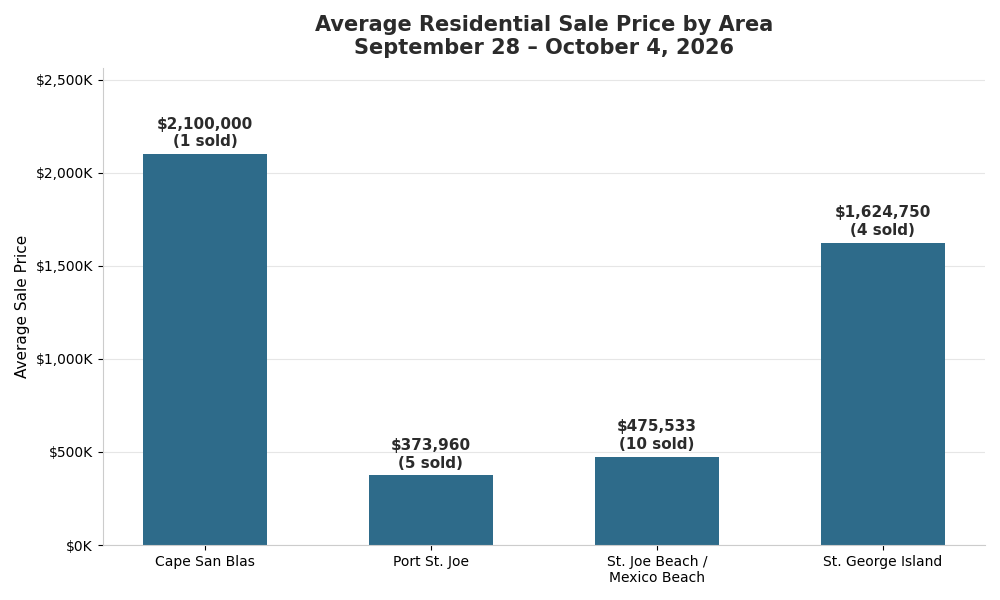
The island closed 4 homes, and not one of them came in under $1,250,000. The top sale hit $3,000,000, edging past the $2.9 million island sale from two weeks ago for the biggest residential closing in the five weeks behind this report. The four averaged $1,624,750.
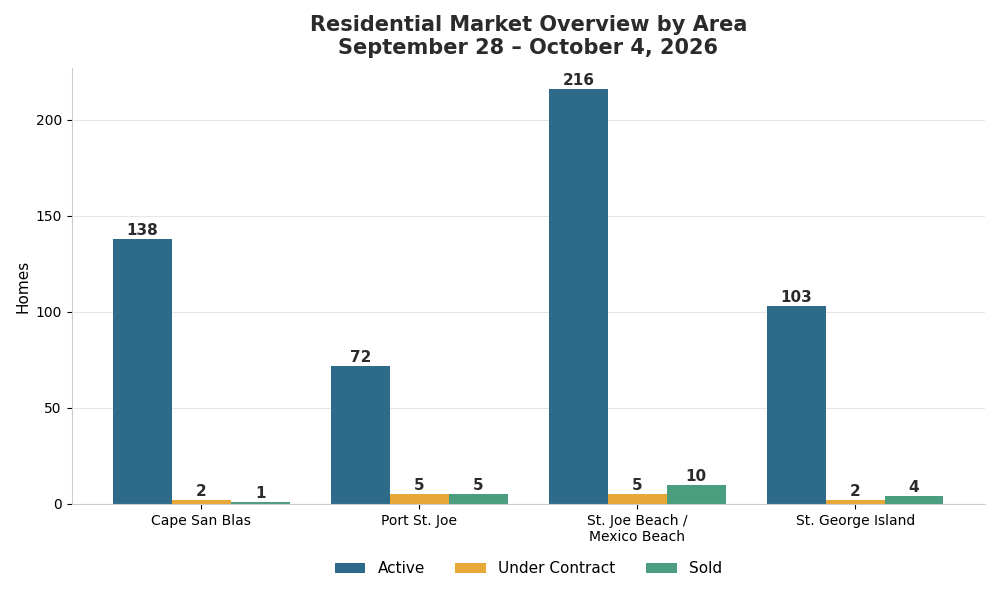
St. George now reads 5.9 months of supply on the three-week pace, down from 9.1 last week. Active listings slipped to 103, the lowest count the island has carried in that five-week stretch, and 2 homes are under contract, the same as last week. If you've been waiting for the top end of the island to soften before you make a move, this week wasn't your sign.
St. Joe Beach and Mexico Beach
The corridor closed 10 homes from $340,000 to $630,000, averaging $475,533. That's its busiest week in the five behind this report. Unlike last week, when one $2.4 million sale pulled the average way up, there's nothing skewing these numbers. Ten houses sold at the prices this stretch of beach has been living at all fall, and that's the healthiest kind of busy there is.
The three-week supply reading dropped to 7.1 months from 11.6. Active inventory dipped to 216 from 218, still the deepest on the coast, and pending contracts climbed to 5 from 1. Last week I said the corridor needed that pending number to recover before anyone could call it balanced. It has started to.
Port St. Joe
Town quietly had its best week of the stretch. 5 closings between $269,900 and $510,000, averaging $373,960. Only 72 active listings are left on the market, down from 76 last week and the fourth straight weekly decline.
On the three-week pace, Port St. Joe now carries 5.0 months of supply, down from 10.5 and the tightest reading of the four areas. Pending contracts rose to 5 from 3. Once a market drops under about 6 months, sellers start holding the better cards, and town is there now. If you've been thinking about listing a house in Port St. Joe, the shelf is as bare as it has been all fall.
Cape San Blas and the South Gulf
The Cape closed 1 home, and it was a big one. At $2,100,000, it's the highest single Cape sale in the five weeks behind this report, and a good reminder that the Gulf-front buyer on the peninsula hasn't gone anywhere.
The rest of the Cape's numbers are still the soft spot on this coast. With just 4 closings across the last three weeks, it reads 23.9 months of supply, up from 19.4 and by far the loosest of the four areas. Active listings did tick down to 138 from 140, the first decline after two straight increases. 2 homes are under contract, down from 3. If there's anywhere on the Forgotten Coast where a buyer can still find a treat this October, it's the Cape, especially below $1 million, where nothing closed this week.
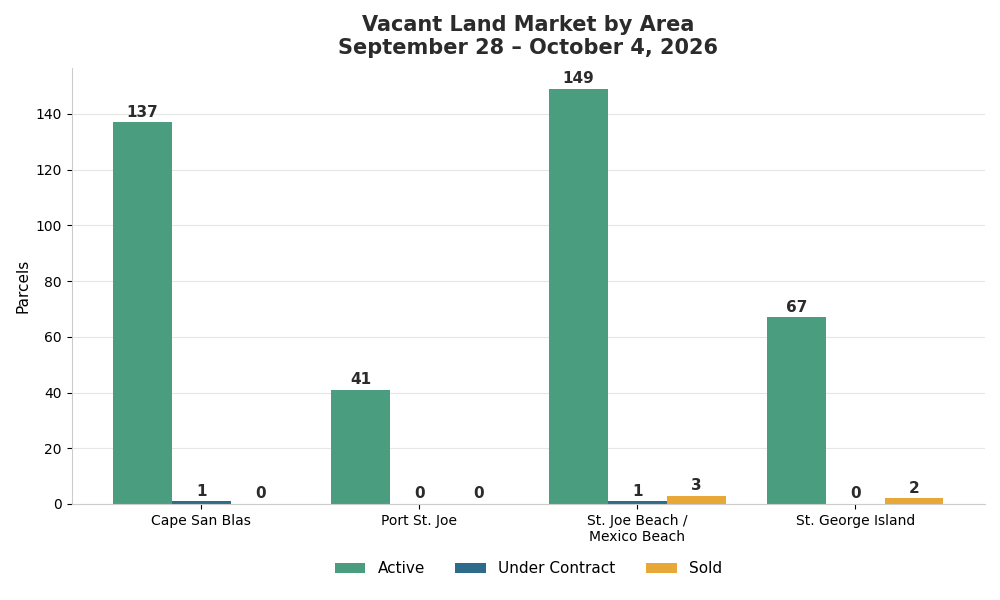
The Land Market
Five lots sold, up from 4, on $1.78 million of volume. The average jumped to $356,600, the highest weekly land average in the five weeks behind this report.
The beach corridor drove it with 3 sales from $160,000 to $915,000. That $915,000 lot is the most anyone has paid for a parcel on this coast in the stretch I've been tracking, well past the $500,000 island lot from the week of September 7–13. St. George Island added 2 lots, at $98,000 and $430,000. Cape San Blas and Port St. Joe sat the week out.
Land inventory fell to 394 active parcels from 405, the first drop after two straight increases. Only 2 lots are under contract, though, the fewest in five weeks, so next week's land numbers could run quiet. At this week's pace the land market carries 18.2 months of supply. Builders and anyone planning to buy now and build later still have plenty to pick from.
What the Pace Actually Means
Twenty sales a week projects to about 87 homes a month, which against 529 active listings reads 6.1 months of supply. That's a seller-friendly number for a single week, and I'd hold it loosely. One big week doesn't make a season.
The three-week figure is the one I trust, and it moved the right way in a hurry. Last week I said the slow holiday week of September 7–13 would roll out of the window and the smoothed number should come back down. It did, and then some. The coast has averaged about 15.7 closings a week over the last three weeks, which puts supply at 7.8 months, down from the 12.0 months I published last week. Active inventory fell to 529, the fourth straight weekly decline and the lowest count in the five weeks behind this report.
Here's where the negotiating power sits right now. Sellers in Port St. Joe and on St. George Island have the stronger hand, with both areas under 6 months of supply. The beach corridor moved toward the middle this week, while Cape San Blas is still a buyer's market by a wide margin and rewards anyone willing to do the homework.
A Note on What This Report Covers
This weekly report tracks residential and vacant land activity across Florida's Forgotten Coast, covering the Port St. Joe real estate market, Cape San Blas and the South Gulf, the St. Joe Beach and Mexico Beach corridor, and the St. George Island market. Each week it pulls active listings, pending contracts, closed sales, price ranges, and months of inventory from the MLS and runs them the same way, so the week-to-week comparisons actually mean something.
What October Looks Like From Here
The porch pumpkins are starting to show up around town, and the evenings finally have a little bite to them, enough to make you dig out the jacket you didn't need a month ago. Out on the Cape the beach is empty enough at sunset that the only thing following you down the sand is your own long shadow.
October is also when the serious buyers come out. These are the folks who have been watching listings since summer and finally booked the trip, and this week twenty of them made it to the closing table. With 14 more homes under contract and active inventory the thinnest it has been this fall, sellers who price it right over the next few weeks are going to find this market a lot less scary than the national headlines make it sound.
If you're thinking about buying or selling this fall and want a straight read on what the data means for your situation, reach out. No pressure, just a real conversation about the market from someone who lives and works here.
Key Metrics Summary
|
|
Area Detail
| Area | Active | Under Contract | Sold | Sold Price Range | Avg Sold Price | Months Supply (3-Wk) |
| Cape San Blas / South Gulf | 138 | 2 | 1 | $2,100,000 | $2,100,000 | 23.9 |
| Port St. Joe | 72 | 5 | 5 | $269,900 – $510,000 | $373,960 | 5.0 |
| St. Joe Beach / Mexico Beach | 216 | 5 | 10 | $340,000 – $630,000 | $475,533 | 7.1 |
| St. George Island | 103 | 2 | 4 | $1,250,000 – $3,000,000 | $1,624,750 | 5.9 |
Vacant Land Detail
| Area | Active | Under Contract | Sold | Sold Price Range |
| Cape San Blas / South Gulf | 137 | 1 | 0 | None |
| Port St. Joe | 41 | 0 | 0 | None |
| St. Joe Beach / Mexico Beach | 149 | 1 | 3 | $160,000 – $915,000 |
| St. George Island | 67 | 0 | 2 | $98,000 – $430,000 |
Enjoy this blog post? Click here to subscribe for updates
Leave A Comment