
The Coast Snaps Back, and St. George Island Sets the Ceiling
Last week I had to report four closings and explain why that was a holiday artifact and not a market. This week the coast handed me the other half of the argument.
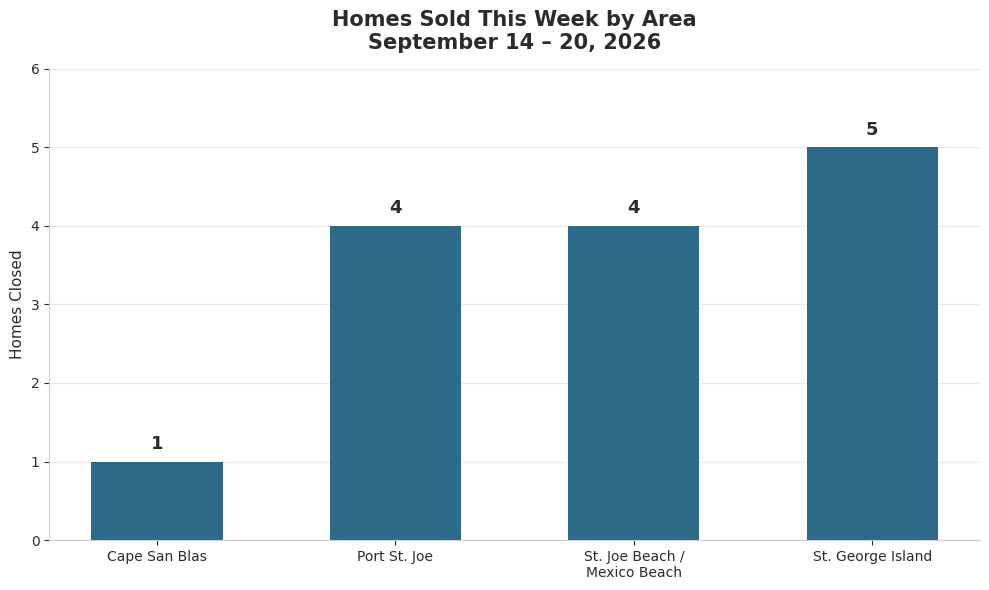
Fourteen homes closed on the Forgotten Coast between September 14 and 20, three and a half times the prior week's count, on $13.08 million of volume against $2.93 million the week before. That is the heaviest dollar week of the last month out here. And St. George Island, which had closed nothing at all seven days earlier, put 5 homes on the board including a $2,900,000 sale that is the largest residential closing in the four weeks behind this report.
What is the Forgotten Coast real estate market doing this week?
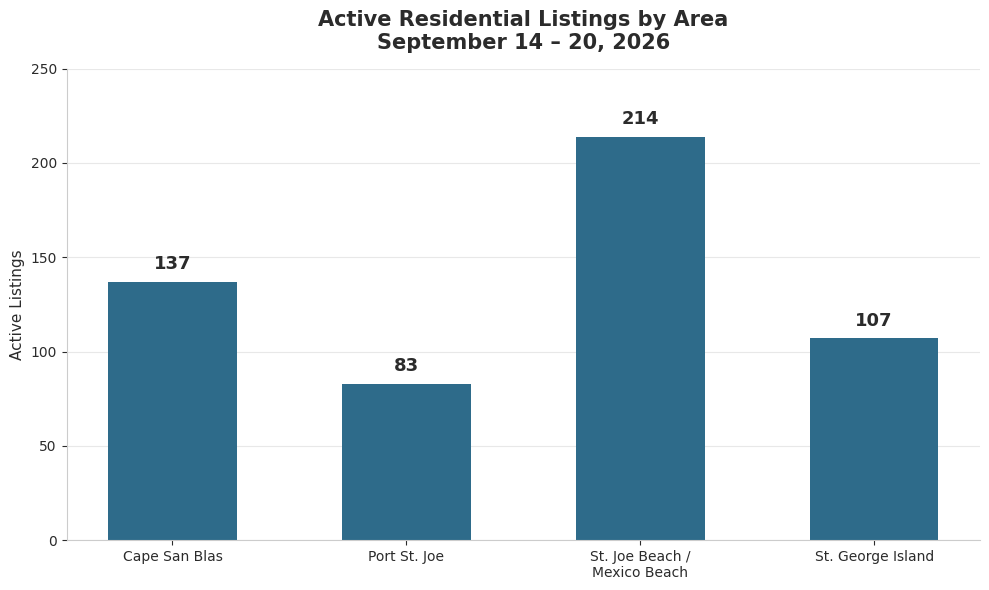
For the week of September 14–20, 2026, the Forgotten Coast recorded 14 residential closings and 4 vacant land sales across Port St. Joe, Cape San Blas, St. Joe Beach, Mexico Beach, and St. George Island. Active inventory sits at 541 residential listings, which at this week's pace reads 8.9 months of supply, though the steadier three-week average still puts it at 10.7 months. Pending contracts doubled to 20 coast-wide, the strongest pipeline in three weeks.
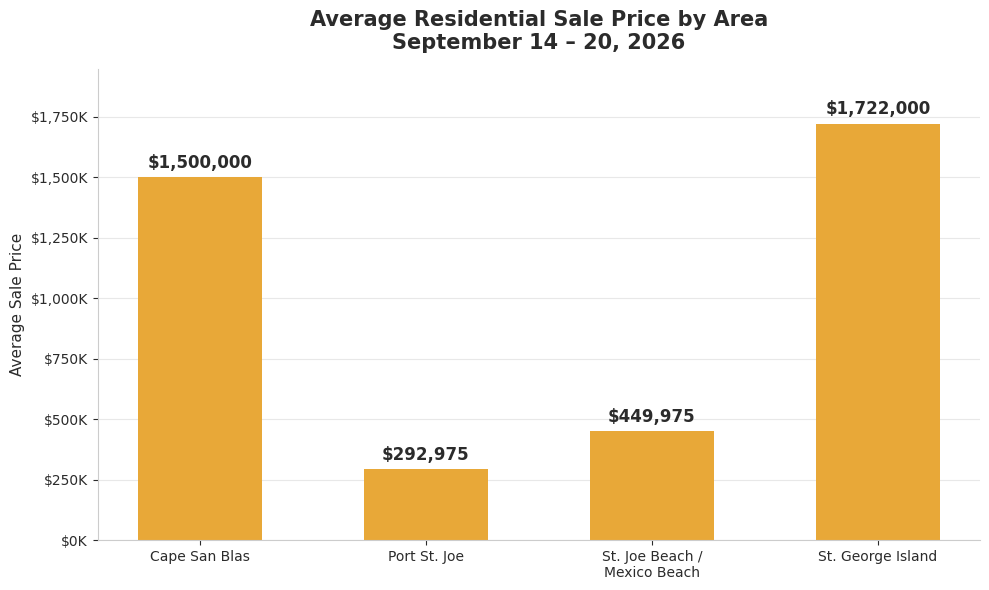
Sales ranged from $200,000 to $2,900,000 and averaged $934,414, a figure pulled upward hard by the island. Every area closed at least one home, which has not happened since the week of August 24–30. The spread of what sold is the part worth sitting with: four houses in the $247,000 to $345,000 band in town, four more between $200,000 and $585,000 along the beach corridor, and then the island operating in a different atmosphere entirely.
St. George Island
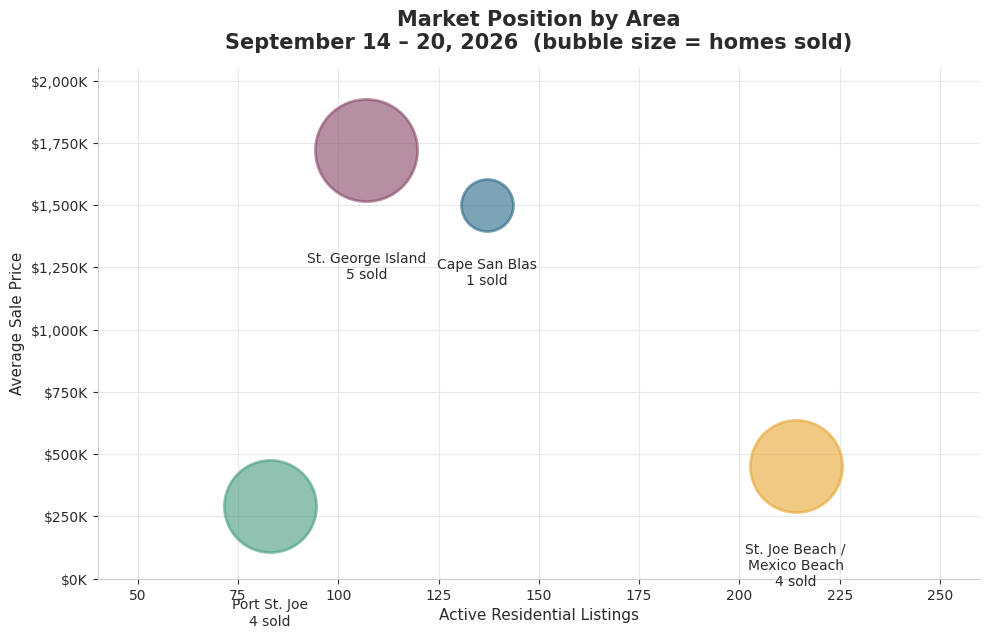
The island had the week. 5 closings, its best of the last month, at an average of $1,722,000 and a top price of $2,900,000. The low end of its week was $550,000, which tells you the buyers were not clustered at one price point. That is five separate decisions across a wide band, not one wave.
Run those sales against the last three weeks and St. George now prints 8.2 months of supply, the tightest reading of the four areas and a real improvement on the 12.2 months it carried last week. It holds 107 active listings and 4 under contract. After a blank week I called noise rather than news, that read holds up.
Port St. Joe
Town had its best week of the month too, and it did it in the price range that actually matters to people who live here. 4 closings between $247,000 and $345,000, averaging $292,975. That is the lowest weekly average Port St. Joe has posted in this stretch, and I mean that as a compliment to the market rather than a worry. Houses at that number are the ones young families and working couples can actually finance.
The pipeline backs it up. 8 homes under contract against 83 active listings, the fewest active of any area on the coast and the strongest pending count town has carried in the four weeks behind this report. Its three-week supply reading dropped to 9.6 months from 14.6 last week, the biggest single-week improvement anywhere on the coast. If you own a house in town under $400,000, the buyer pool just showed itself.
St. Joe Beach and Mexico Beach
The corridor turned in 4 closings from $200,000 to $585,000, averaging $449,975. Steady, which is what that stretch does. It also picked its pipeline back up to 8 under contract, its best since the 9 it carried the week of August 24–30.
Its inventory story is the one to watch. 214 active listings is still the deepest on the coast by a wide margin, and because the corridor's big 10-sale week has now rolled out of the three-week window, its smoothed supply reading climbed to 11.4 months from 7.9 last week. Nothing broke. The arithmetic just stopped flattering it. Price accordingly if you are listing between St. Joe Beach and the Mexico Beach line this fall.
Cape San Blas and the South Gulf
The Cape closed 1 home, at $1,500,000. One sale is not a trend in either direction, but the column beside it is starting to say something. 0 under contract, for the second straight week, across 137 active listings. Two consecutive weeks with nothing pending is the first such stretch in the month behind this report, and it means the Cape's October closing calendar is going to look thin no matter what happens in the next ten days.
Active inventory out there also ticked up to 137 from 136, its first weekly increase in this stretch after three straight declines. On the three-week pace the Cape now reads 13.6 months of supply, the loosest of the four areas and wider than the 10.5 months I published last week. Buyers working the Cape above $900,000 have more room this week than they did seven days ago, and they should use it.
The Land Market
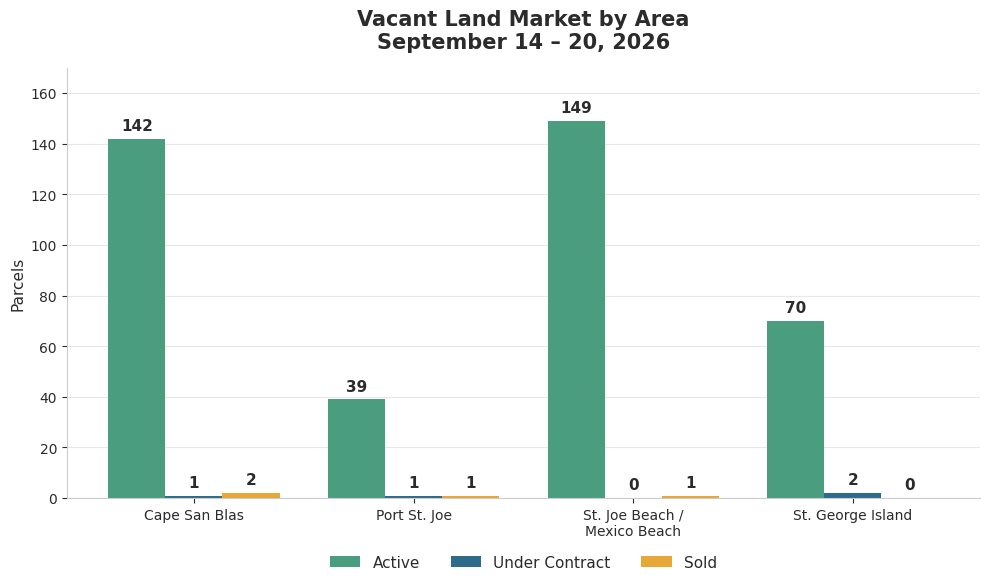
Four lots traded, one fewer than last week, but they traded higher. The week's average land price came in at $340,000 on $1.36 million of volume, the strongest weekly land average of the last month by a wide gap.
Cape San Blas led it with 2 sales, at $335,000 and $482,000, the Cape's first two-lot week in this stretch. Port St. Joe closed 1 at $375,000, the highest land price town has recorded in the four weeks behind this report. The St. Joe Beach and Mexico Beach corridor added 1 at $168,000. St. George Island sat it out after 2 the week before.
Land inventory rose to 400 active parcels from 389, its first weekly increase in this stretch, and the pending count fell back to 4 from 9. At this week's pace that is 23.1 months of supply. Lots are still the most patient asset on this coast, but the prices tell you something changed in who is buying them. Nobody paid $482,000 for a Cape lot to flip it.
What the Pace Actually Means
Fourteen sales a week projects to about 61 homes a month. Against 541 active listings that reads 8.9 months of supply, which looks like a market that healed itself in seven days. It did not, quite.
Average the last three weeks and the coast has been closing about 11.7 homes a week, putting the three-week supply figure at 10.7 months, up from the 9.9 months I published last week. That is the second week running that the smoothed number has moved the wrong way, and I am going to say so plainly rather than lead with the friendlier weekly figure. The Labor Day hole is still sitting inside that three-week window and it will not roll out until next week's report.
The forward-looking numbers are the genuinely encouraging part. 20 homes under contract coast-wide, doubled from 10 last week and the highest count since the 22 of late August. Active inventory fell again to 541 from 543, a third straight weekly decline and the lowest count of the month. Last week I pointed out that inventory falling while nothing closes is just listings expiring. This week it fell while fourteen houses sold and twenty more went pending. That is a different animal.
Where the leverage sits right now: buyers still have real room at Cape San Blas and anywhere on the coast above $900,000, with the Cape's 13.6-month reading and empty pending column making that case on its own. Sellers have the better hand in Port St. Joe under $400,000 and on St. George Island, the two markets that tightened this week. The beach corridor is somewhere in the middle and drifting toward the buyer.
A Note on What This Report Covers
This weekly report tracks residential and vacant land activity across Florida's Forgotten Coast: the Port St. Joe real estate market, Cape San Blas and the South Gulf, the St. Joe Beach and Mexico Beach corridor, and the St. George Island market. Active listings, pending contracts, closed sales, price ranges, and months of inventory, pulled from the MLS and run the same way every week so the comparisons actually mean something.
What the Fall Looks Like From Here
This was the last full week of summer on the calendar. You can feel the turn already. The afternoon storms have thinned out, the Gulf has gone that flat glassy green it saves for October, and you'll find people fishing the bay for the pure pleasure of it. The Cape is quiet enough that you can walk a mile of it and see three sets of footprints, two of them yours.
Fall is also when the serious buyers show up out here. They are not booking a vacation week and falling for a sunset. They have been watching a listing since June, they know what it was asking in July, and they have run the numbers twice. With 20 contracts pending coast-wide and 541 homes sitting active, the ones that close between now and Thanksgiving will be the ones priced for that buyer. The island proved this week that the money is here when the house is right.
If you're thinking about buying or selling this fall and want a straight read on what the data means for your situation, reach out. No pressure, just a real conversation about the market from someone who lives and works here.
Key Metrics Summary
|
|
Area Detail
| Area | Active | Under Contract | Sold | Sold Price Range | Avg Sold Price | Months Supply (3-Wk) |
| Cape San Blas / South Gulf | 137 | 0 | 1 | $1,500,000 | $1,500,000 | 13.6 |
| Port St. Joe | 83 | 8 | 4 | $247,000 – $345,000 | $292,975 | 9.6 |
| St. Joe Beach / Mexico Beach | 214 | 8 | 4 | $200,000 – $585,000 | $449,975 | 11.4 |
| St. George Island | 107 | 4 | 5 | $550,000 – $2,900,000 | $1,722,000 | 8.2 |
Vacant Land Detail
| Area | Active | Under Contract | Sold | Sold Price Range |
| Cape San Blas / South Gulf | 142 | 1 | 2 | $335,000 – $482,000 |
| Port St. Joe | 39 | 1 | 1 | $375,000 |
| St. Joe Beach / Mexico Beach | 149 | 0 | 1 | $168,000 |
| St. George Island | 70 | 2 | 0 | None |
Enjoy this blog post? Click here to subscribe for updates
Leave A Comment