

Vacant Land Outsold Houses on a Quiet Labor Day Week
The week opened on Labor Day, and the coast did what it always does once that last long weekend burns off. Traffic thinned on 98, and the closing calendar, which had been running hot since the first week of August, went nearly silent.
Four homes closed on the Forgotten Coast between September 7 and 13. Four. After three straight weeks of fifteen, seventeen, and seventeen, that reads like somebody unplugged the market. The vacant land side, though, kept right on working, and for the first time in a month it closed more deals than the houses did.
What is the Forgotten Coast real estate market doing this week?
For the week of September 7–13, 2026, the Forgotten Coast recorded 4 residential closings and 5 vacant land sales across Port St. Joe, Cape San Blas, St. Joe Beach, Mexico Beach, and St. George Island. Active inventory stands at 543 residential listings, which on a three-week average pace works out to 9.9 months of supply, up from 7.8 months a week ago. Land outsold houses for the first time in a month, and with only 10 homes under contract coast-wide, the October closing calendar looks thin.
Total residential dollar volume came to $2.93 million, against $11.93 million the week before. The four sales ranged from $539,900 to $1,250,000 and averaged $732,475, though an average built on four transactions is a fact about those four houses and not much else. Two of the four areas closed nothing at all.
Cape San Blas and the South Gulf
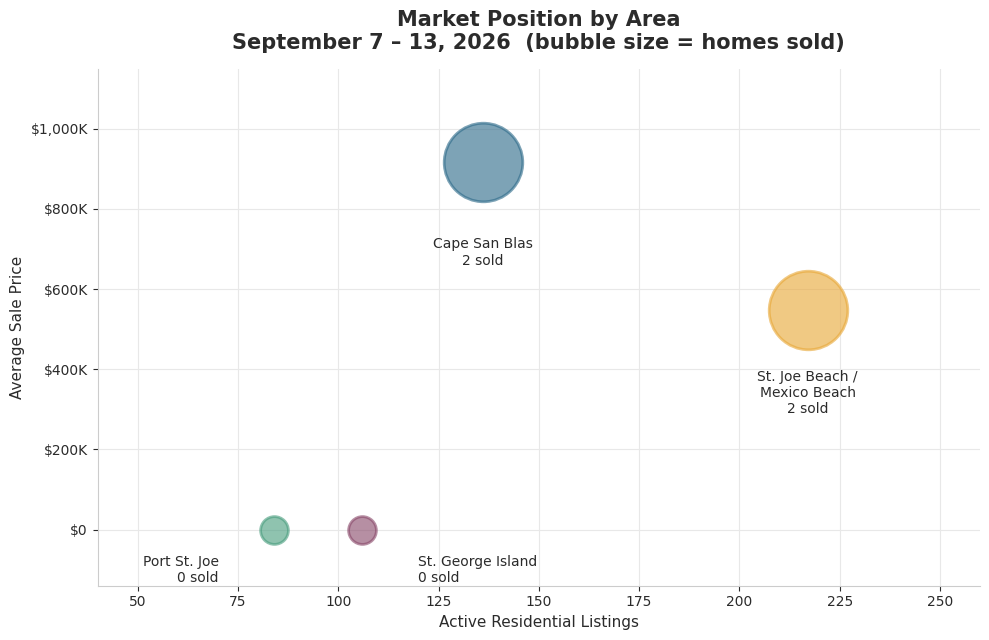
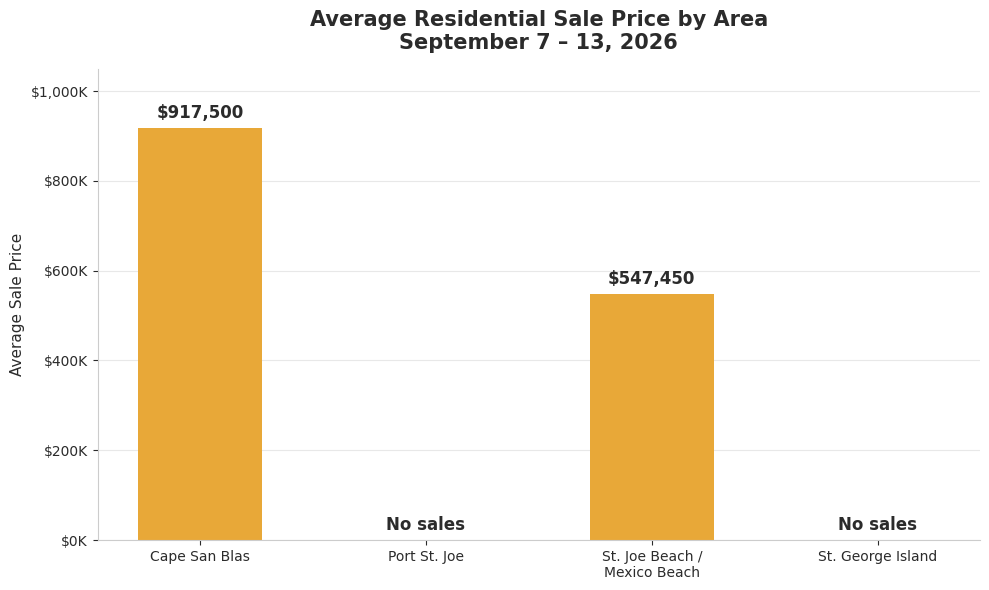
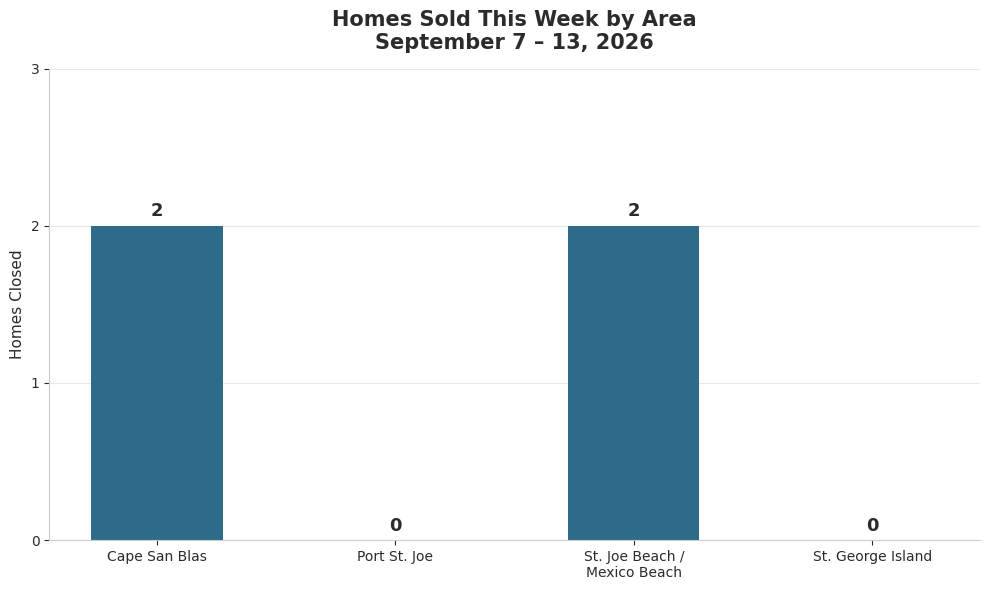
The Cape closed 2 homes, at $585,000 and $1,250,000, averaging $917,500. That is the fourth week running the Cape's weekly average has stepped down, from $1,156,750 in mid-August through $1,100,000 and $1,041,475 to where it sits now. Before anybody reads a collapse into that line, look at the sample size behind it. Two to four closings a week. What that trend actually tracks is which houses happened to fund, not what the Cape is worth.
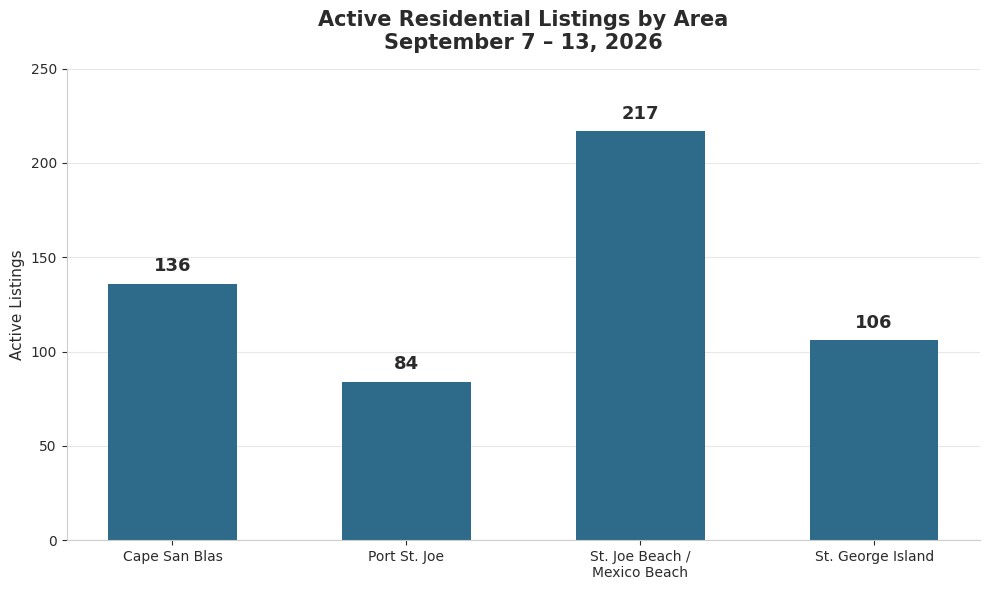
The column I would watch out there instead is under contract, and this week it reads 0. Not one home pending across 136 active listings. That is the first blank in that cell in the month of data behind this report, and it means the Cape's first half of October is already spoken for, in the unhappy sense. On the three-week pace the Cape now sits at 10.5 months of supply, loosened from 8.8 months last week.
St. Joe Beach and Mexico Beach
The corridor did what it has done most of this year, which is hold the coast up. Its 2 closings were the only other sales on the board, at $539,900 and $555,000. Two houses, roughly $15,100 apart, sold in the same week. That is not a coincidence so much as a signature. There is a real, identifiable pool of buyers working the mid five hundreds along that stretch, and they are still writing.
At 217 active listings the corridor carries the deepest inventory on the coast by a wide margin, but run it against its last three weeks of closings and it prints 7.9 months of supply, the tightest of the four areas. Turnover forgives a lot of listings. It also holds 6 of the coast's 10 pending contracts, which is the only pipeline out here with real weight in it right now.
Port St. Joe
Town closed nothing. Its 84 active listings are the fewest of any area on the coast and 3 of them are under contract, the best pending-to-active ratio anywhere out here this week. A blank Monday-to-Sunday in Port St. Joe is not a crisis. It runs on a smaller board than the beach markets, so one slow stretch swings the percentages harder than it should.
Still, the smoothed reading deserves a look. On the three-week pace Port St. Joe now carries 14.6 months of supply, the softest of the four areas, up from 7.5 months last week. If you own something in town and you have been waiting on a number to make a decision, that is the number.
St. George Island
The island came up empty on houses too, its first blank week in the month behind this report. 106 active listings, 1 under contract, no closings. St. George has been streaky since June, running 4 sales one week and 2 the next, so an off week by itself is noise rather than news. Its three-week supply reading of 12.2 months is a wider gap than I would like, but the island has closed 8 homes in the previous three weeks and nothing about the inventory picture suggests that stops.
The island's land market, meanwhile, had the best week anybody had.
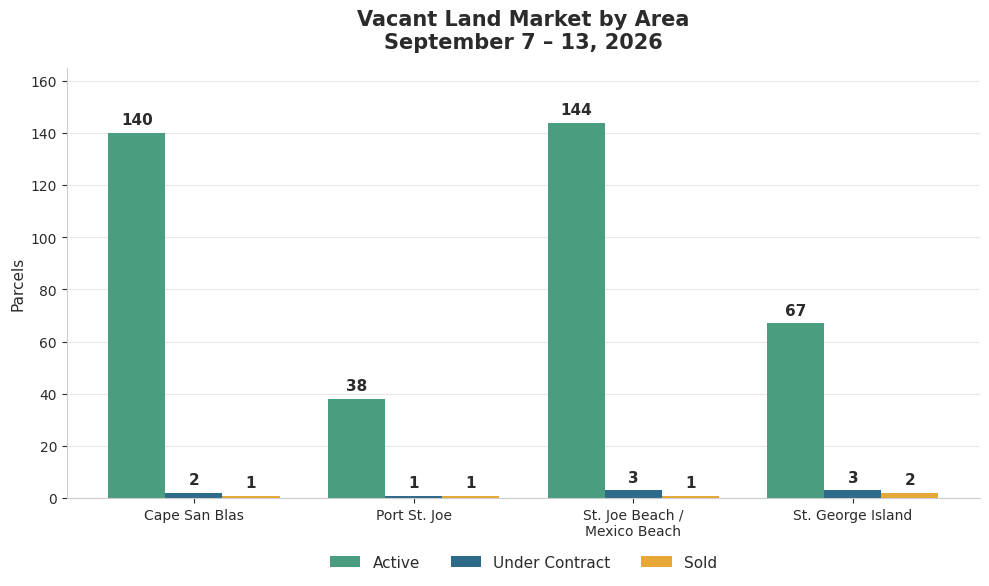
The Land Market
Five lots traded across the coast, one more than the houses managed. All four areas put at least one on the board, something that last happened the week of August 17–23.
St. George Island took the top of the market with 2 sales, at $132,500 and $500,000. That half-million-dollar parcel is the largest land closing since the $1,510,000 Cape tract that traded the week of August 17–23. Cape San Blas closed 1 at $150,000, Port St. Joe 1 at $123,000, and the St. Joe Beach and Mexico Beach corridor 1 at $85,000. Average land price for the week landed at $198,100 on $990,500 of volume.
Land inventory sits at 389 active parcels, flat against last week's 390 and the lowest count of the four weeks. At this week's pace that is 18.0 months of supply, improved from 22.5 months a week ago. Deep buyer's market either way. But 9 lots under contract and five closings in a week when houses managed four tells you where the unhurried money is working. A lot does not care what month it is, and it does not care about a holiday weekend.
What the Pace Actually Means
Here is a number I have to hand over straight rather than dress up.
Four sales a week projects to roughly 17 homes a month. Against 543 active listings that reads 31.4 months of supply, and that is not a real figure. It is what happens when you annualize a holiday week and pretend it represents something.
The smoothed reading is the one to trust. Average the last three weeks and the coast has been closing about 13 homes a week, which puts the three-week supply figure at 9.9 months, up from the 7.8 months I published last week. That is a move in the wrong direction and I am not going to narrate around it. Two consecutive weeks of improvement in that line got wiped out by one slow week, and all four areas loosened, not just the two that closed nothing.
The supporting numbers agree. Coast-wide there are 10 homes under contract, down from 11 last week and 22 two weeks back, the lowest pending count in the month behind this report. Active inventory did fall, to 543 from 553, its second straight weekly decline. Inventory dropping because listings expire is a different animal from inventory dropping because houses sell, and this week looks more like the former.
What that means in practice: buyers have more room this week than they had two weeks ago, particularly at Cape San Blas above $900,000 and anywhere in Port St. Joe. Sellers in the $500,000 to $600,000 band along the St. Joe Beach and Mexico Beach corridor are the exception, because that is where the buyers demonstrably are. None of this makes it a bad market. It makes it a September market, and September has looked like this out here for as long as I have been selling.
A Note on What This Report Covers
This weekly report tracks residential and vacant land activity across Florida's Forgotten Coast: the Port St. Joe real estate market, Cape San Blas and the South Gulf, the St. Joe Beach and Mexico Beach corridor, and the St. George Island market. Active listings, pending contracts, closed sales, price ranges, and months of inventory, pulled from the MLS and calculated the same way every week so the week-to-week comparisons actually hold.
What the Fall Looks Like From Here
Fall on the Forgotten Coast is the season locals mostly keep to themselves. The Gulf stays warm into late October. The Cape empties out and the sand goes back to being sand. You can walk into anywhere in Port St. Joe on a Friday night without a wait, and the bay turns that flat pewter color right before sunset that nobody has ever managed to photograph properly.
It is also the season when the market stops flattering anyone. Summer buyers move on a vacation week and a feeling. Fall buyers have already done the arithmetic, watched your listing since June, and know exactly what you were asking in July. With 10 homes under contract coast-wide and 543 of them sitting active, the ones that close between now and Thanksgiving are going to be the ones priced for that buyer rather than for last summer.
Key Metrics Summary
|
|
Area Detail
| Area | Active | Under Contract | Sold | Sold Price Range | Avg Sold Price | Months Supply (3-Wk) |
| Cape San Blas / South Gulf | 136 | 0 | 2 | $585,000 – $1,250,000 | $917,500 | 10.5 |
| Port St. Joe | 84 | 3 | 0 | None | — | 14.6 |
| St. Joe Beach / Mexico Beach | 217 | 6 | 2 | $539,900 – $555,000 | $547,450 | 7.9 |
| St. George Island | 106 | 1 | 0 | None | — | 12.2 |
Vacant Land Detail
| Area | Active | Under Contract | Sold | Sold Price Range |
| Cape San Blas / South Gulf | 140 | 2 | 1 | $150,000 |
| Port St. Joe | 38 | 1 | 1 | $123,000 |
| St. Joe Beach / Mexico Beach | 144 | 3 | 1 | $85,000 |
| St. George Island | 67 | 3 | 2 | $132,500 – $500,000 |
If you're thinking about buying or selling this fall and want a straight read on what the data means for your situation, reach out. No pressure, just a real conversation about the market from someone who lives and works here.
Enjoy this blog post? Click here to subscribe for updates
Leave A Comment